
Harvest 2024 - final report
- Home
- Harvest 2024 - final report

With harvest over, samples in the Premier Nutrition survey have been analysed and ground is now drilled for the year ahead. We can now share this report on the 2024 GB harvest for wheat and barley with relative feed value for use in poultry and pigs.
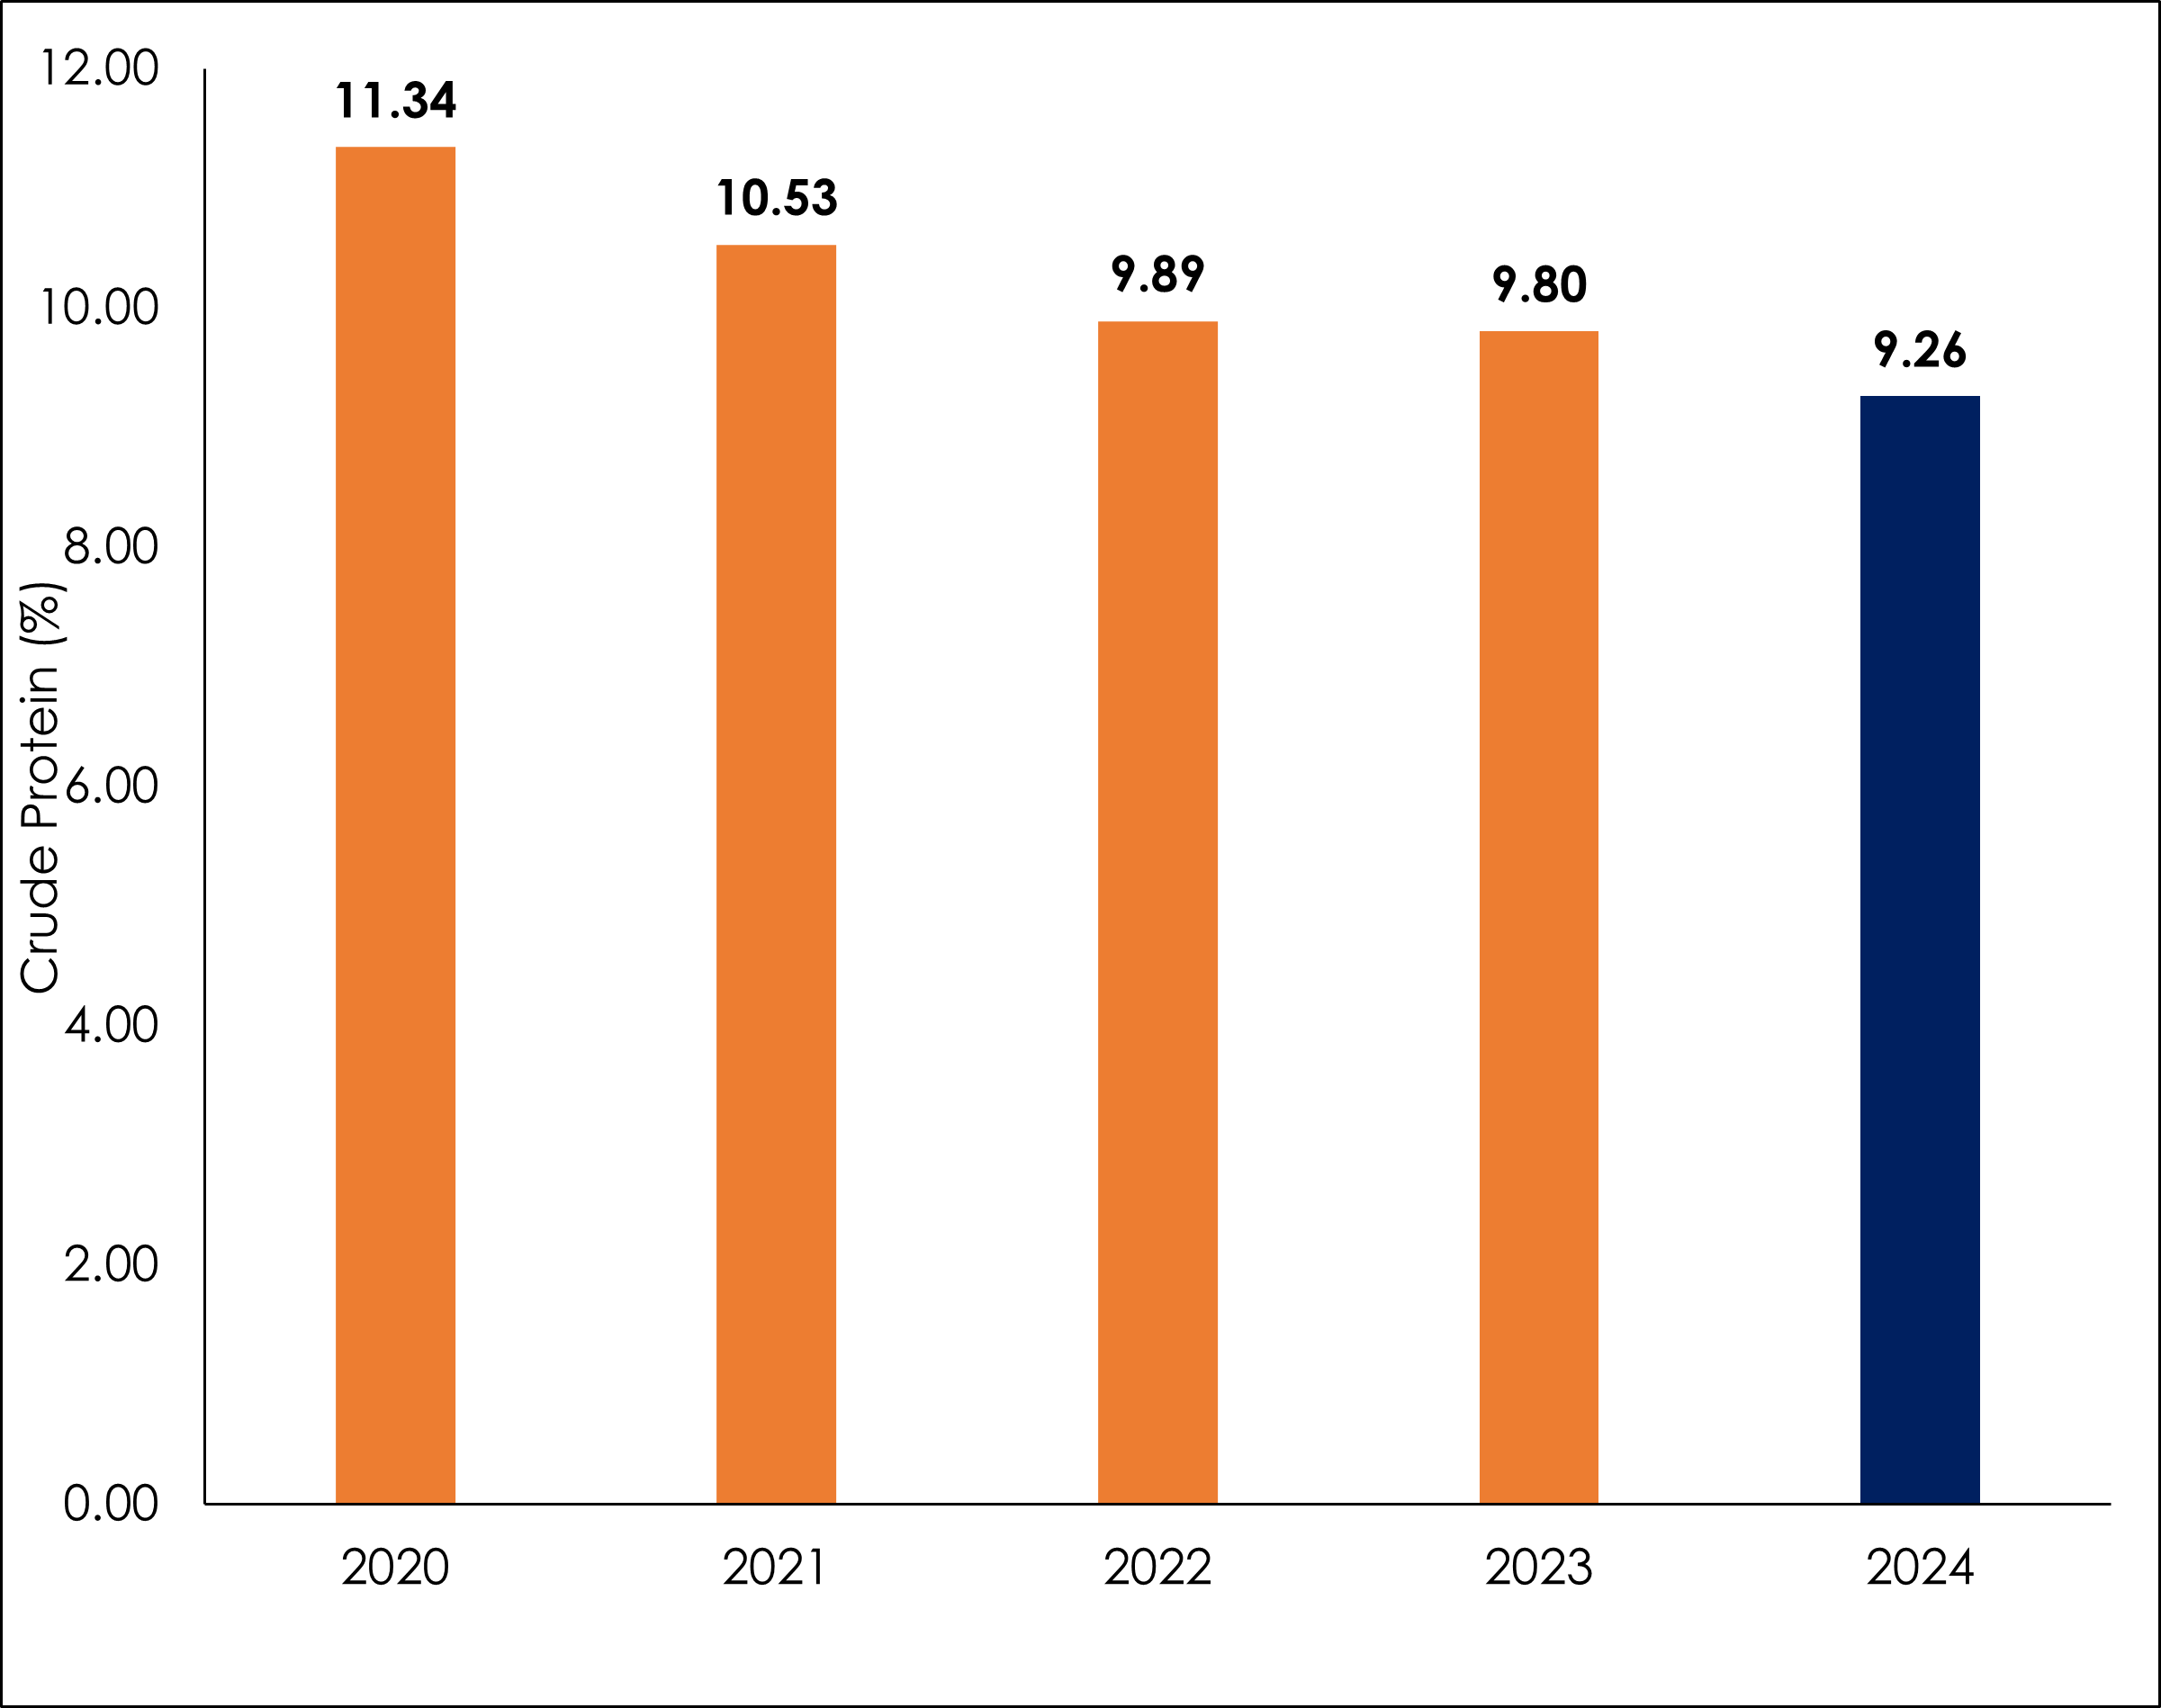
This year, average wheat yields were reported to be around 7.5t/ha (AHDB 2024 Report #6), which was down 7.3% compared against the 5-year average (5YA) and between 0.3-0.8t/ha lower than 2023. Data from samples collected for our harvest report indicate wheat protein has continued its downward trend over the past 5 years and is -0.53% lower compared to 2023. Our results show wheat protein averaged 9.26% in across all regions excluding Scotland (on an as received basis), shown in Figure 1.
Figure 1. Wheat crude protein levels (as received) based on wet chemistry (excluding Scotland) - Premier Nutrition survey results 2024
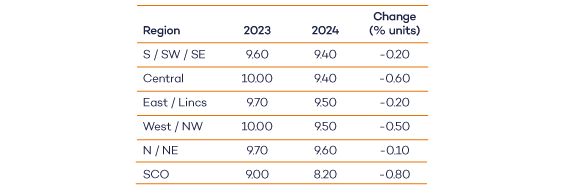
Regional variation is shown in Table 1 between 2023 and 2024. All regions showed a decrease in protein value for wheat, with the least change in the North/Northeast and the most change in Scotland at 0.8% lower than 2023. Scotland showed the lowest wheat protein value and no region showed averages higher than 10%. Regional variation also showed that the highest protein result was from the North/Northeast region at 14.30%, and the lowest result of 4.50% was from Scotland, although both of these extreme results could be deemed as outliers.
Table 1. Regional changes in protein (%) content of wheat (as received) based on wet chemistry - Premier Nutrition survey results 2024
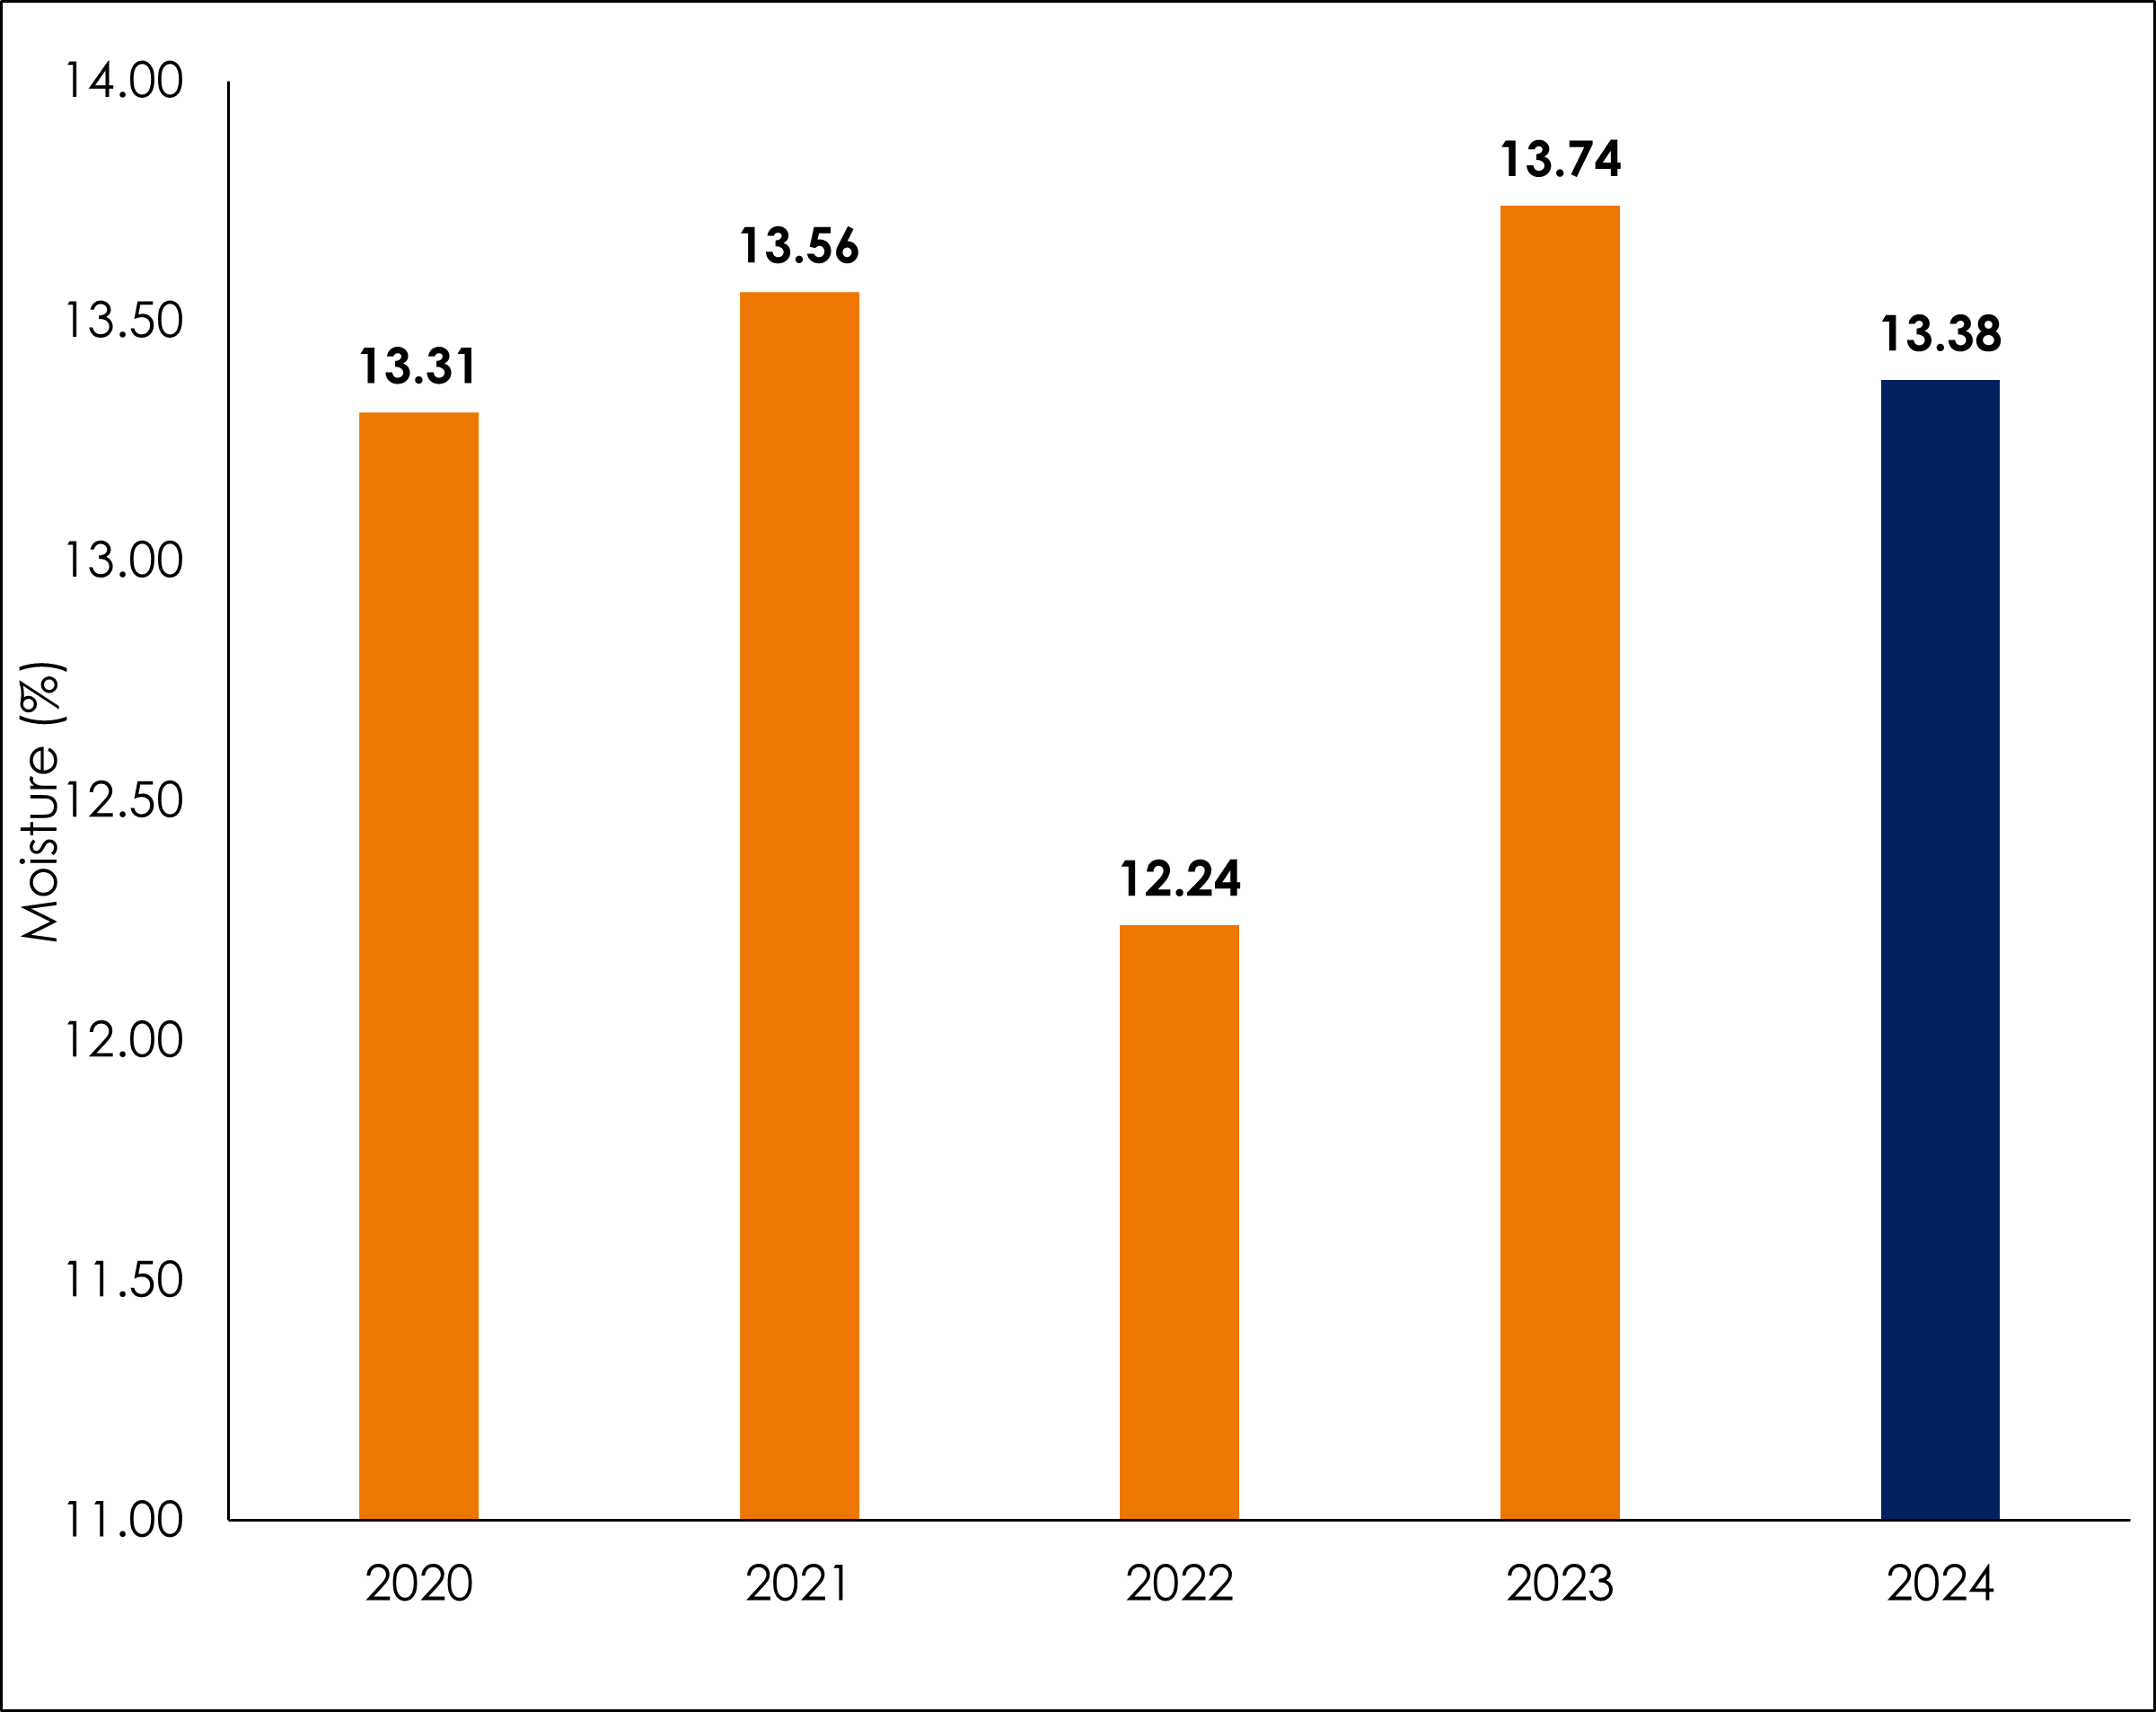
Wheat moisture content was similar to 2023, with more rainfall in the second half of harvest causing some crops to have very high moisture level in certain regions. Before drying, moisture levels around 16% were seen in some samples. Some samples within the data set could have been submitted pre-drying, leading to increased variation within results. Compared to the past 5 years, 2024 wheat moisture contents are on par with other years (Figure 2). Both the highest and lowest moisture levels were recorded in the North/Northeast at 16.3% and 9.3%. Similarly to last year, no average moisture content was below 13%. This year the highest average moisture contents were shown in the West/Northwest, East/Lincs and North/Northeast of 13.5%.
Figure 2. 5-year average wheat moisture content (2020-2024) (excluding Scotland) - Premier Nutrition survey results 2024
Poultry energy was analysed by using the WPSA equation and shows wheat energy values are comparable to last year both on an as received basis and corrected basis (at 13.50% moisture) (Table 2). Over a 5-year period, energy is also very comparable on both an as received and corrected basis.
This year, our survey has grown in the number of samples submitted through greater cross species collaboration. As our sample size grows, the deviation between our results becomes smaller and it could be suggested that results this year compared to previous years are more accurate, although outlying results could still occur.
Table 2. AMEn values for wheat between 2019 and 2023 calculated using the WPSA energy equation (excluding Scotland)

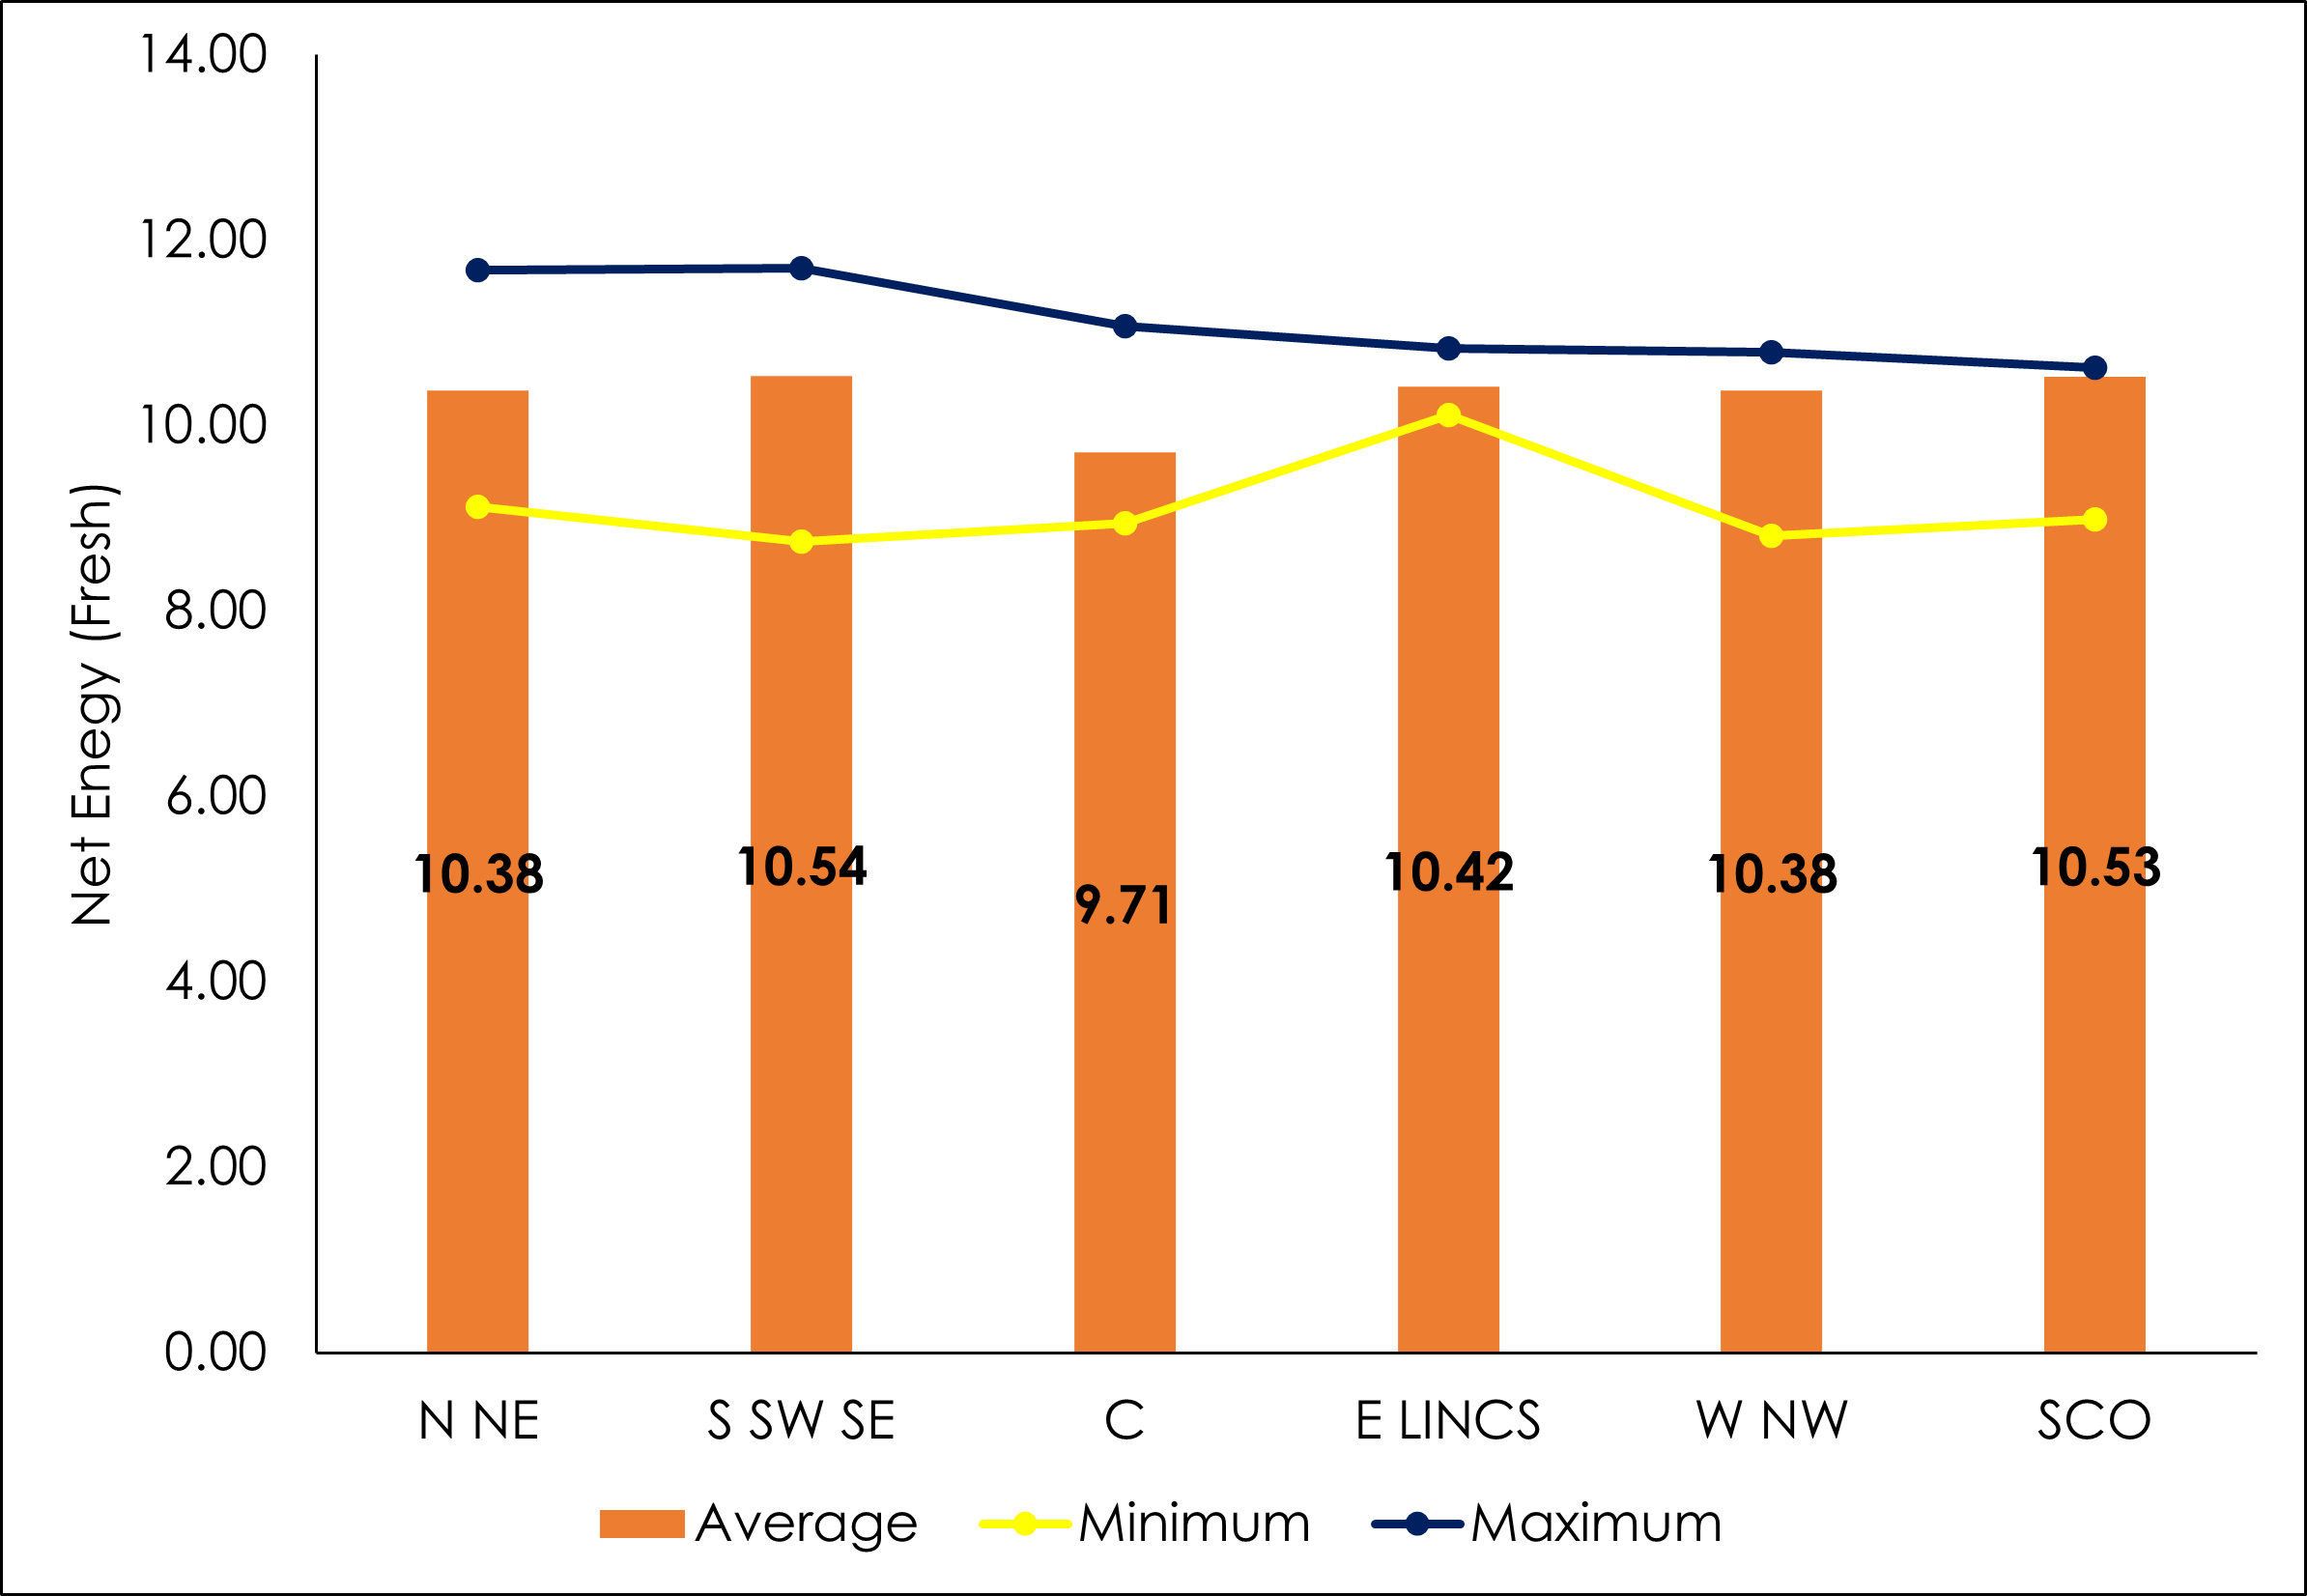
Pig Net Energy (NEp), calculated by the Sauvant et al., 2002 equation, is calculated to be 10.3 MJ/kg excluding Scotland. Our previous surveys haven’t analysed all the nutrients required to calculate NEp, but the 2024 wheat energy value is slightly lower than what we would consider ‘average’ which might be expected to be nearer 10.61 MJ/kg (Premier Atlas, 2019). The variation in energy between regions is shown in Figure 3.
Figure 3. Regional overview of net energy for wheat in 2024 (as received basis)
Like wheat, the average barley yields (depending on variety) were down compared to 2023. Yields showed between 5.7 (spring) - 6.13 (winter) t/ha. Winter barley yield was down 13% against the 5YA, whereas spring barley was only down 3.4% against the 5YA (AHDB 2024 Report #6).
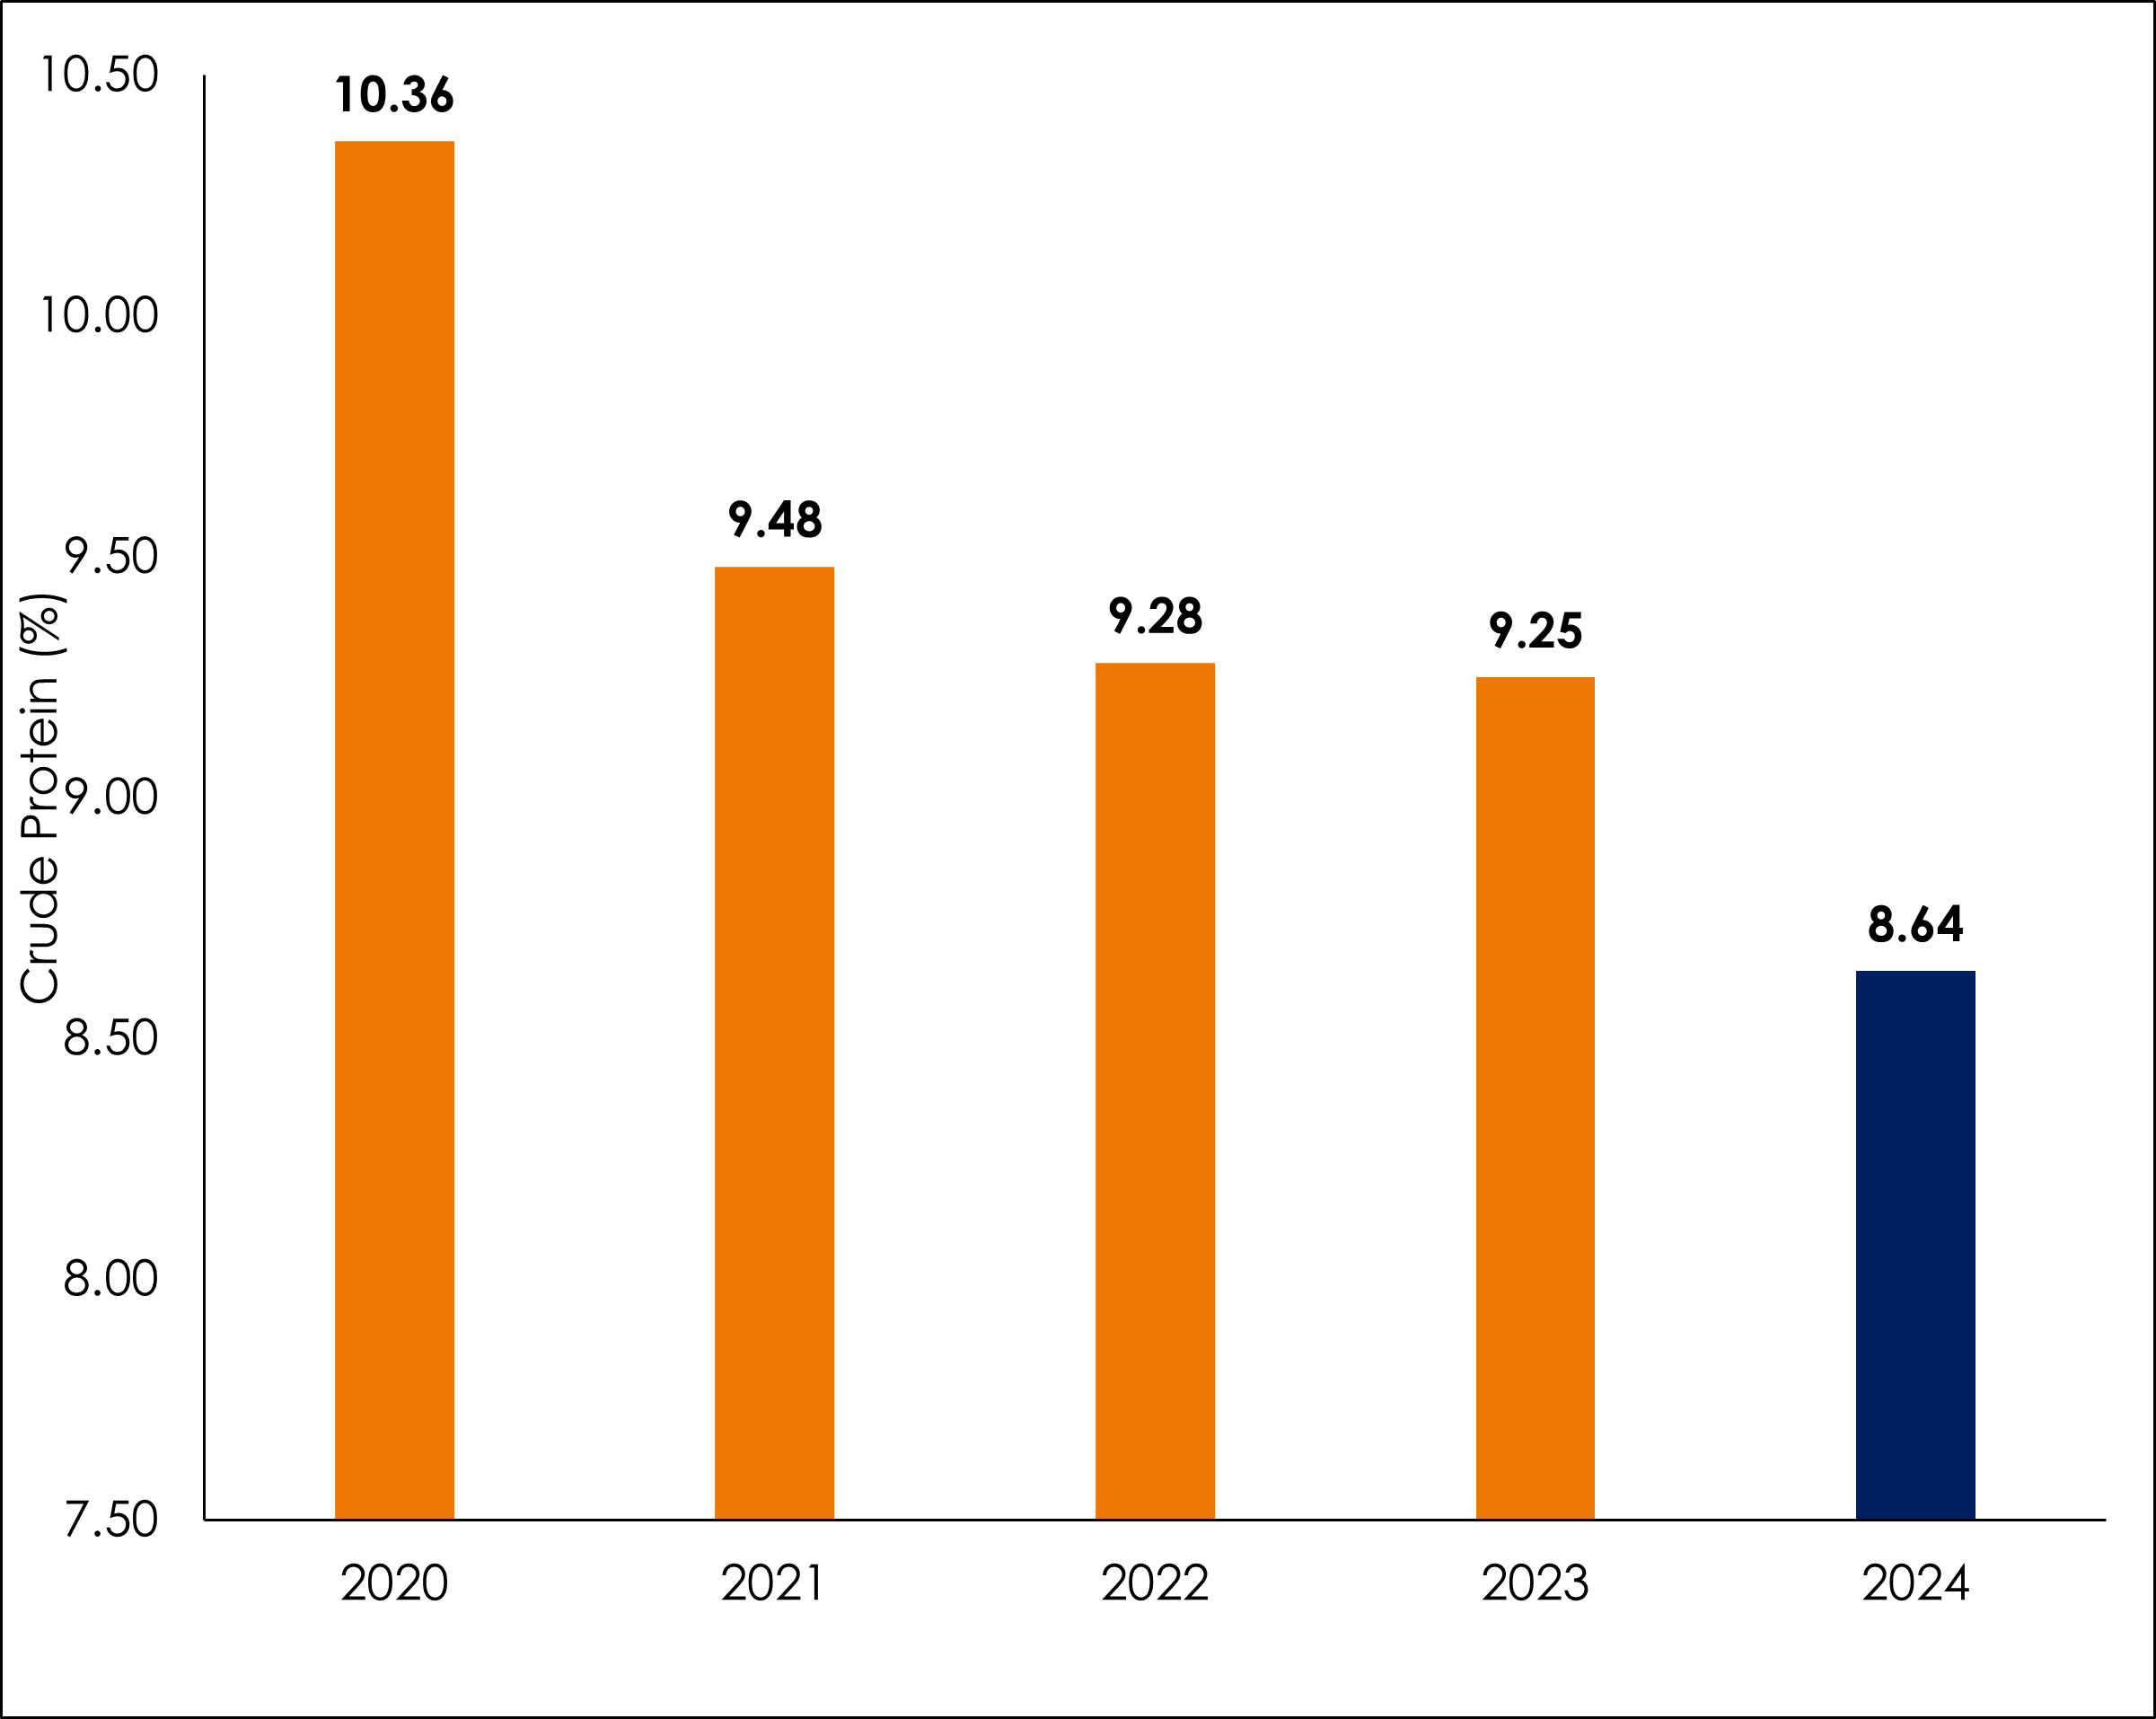
Barley samples received from our survey indicate average protein to be 8.64% on an as received basis (excluding Scotland), the lowest value in the last 5 years and 0.6% lower than 2023 (Figure 4). Regional variation showed that the highest result of 14.3% was from the North/Northeast region and the lowest of 6.7% from the South/Southwest/Southeast. Regionally, average barley protein was lowest in the South/Southwest/Southeast at 8.3% and highest in the Central and North/Northeast at 9%.
Figure 4. Barley crude protein levels (as received) based on wet chemistry (excluding Scotland) - Premier Nutrition survey results
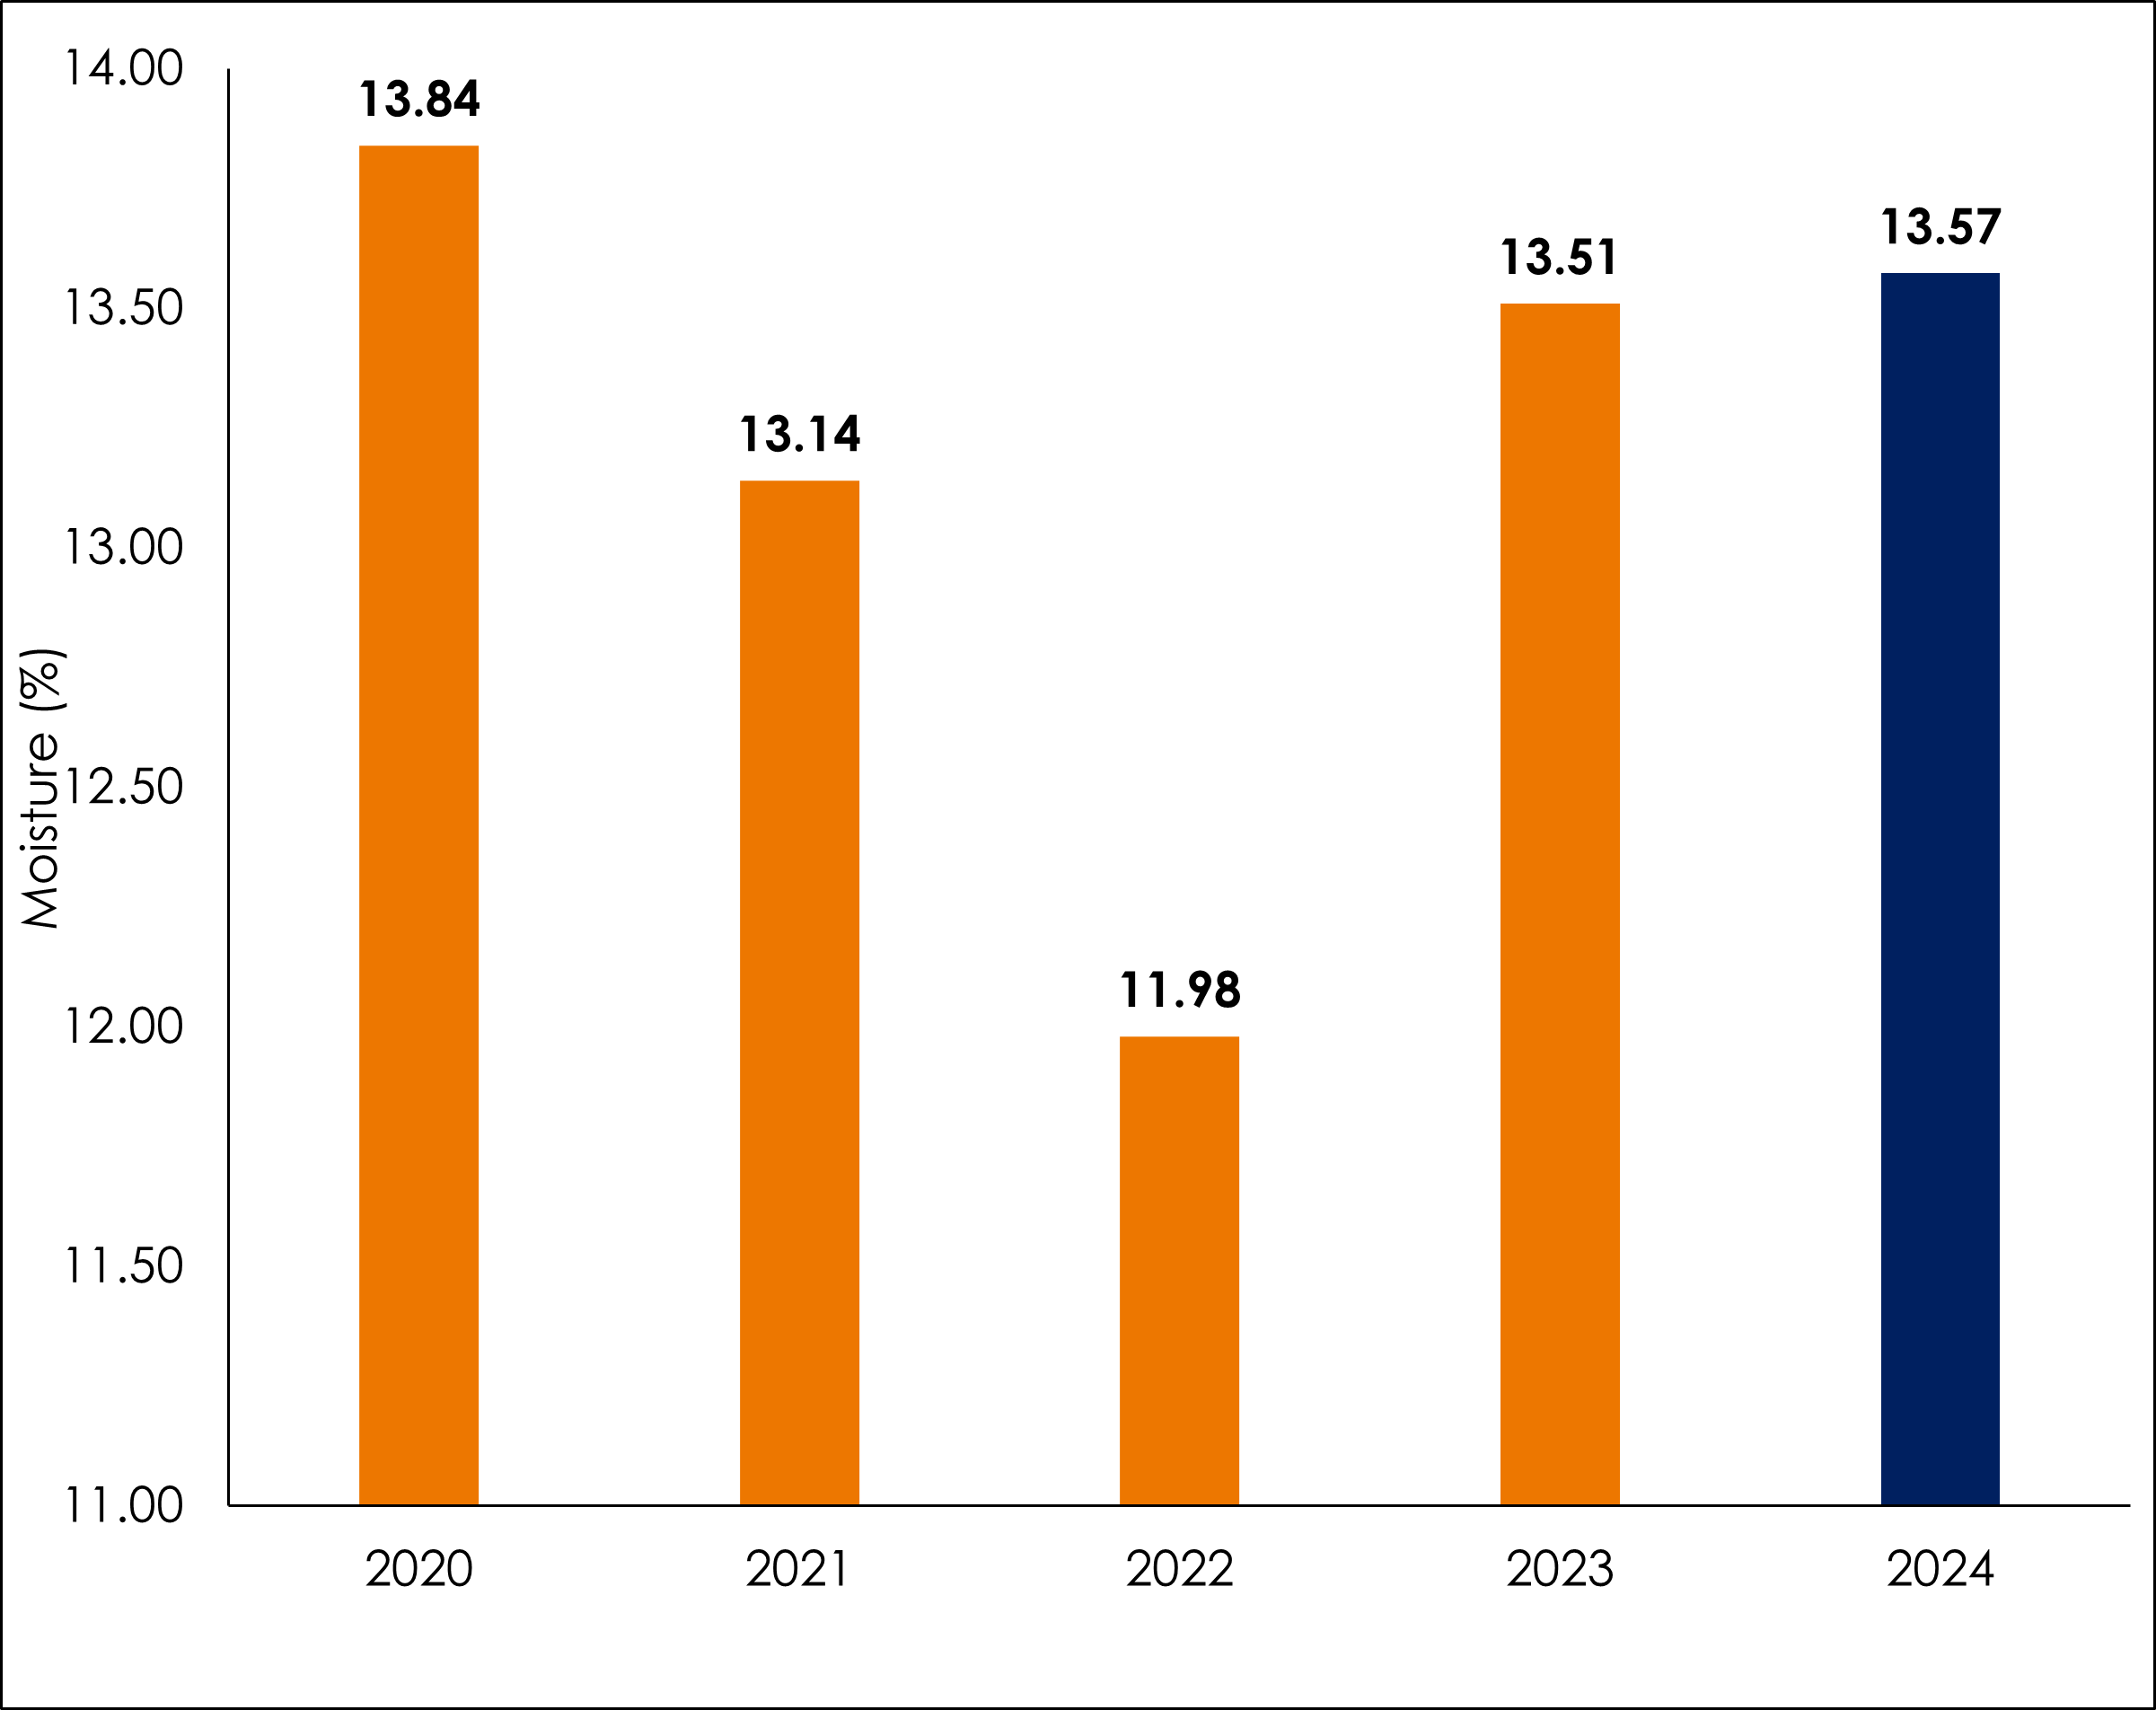
Moisture content was slightly higher than last year, though in line with the last 5 years (except 2022). This year’s average barley moisture content was recorded at 13.57% (Figure 5).
Figure 5. 5-year average barley moisture content (2020-2024) (excluding Scotland) - Premier Nutrition survey results
The WPSA energy equation was also used when calculating barley energy levels. The values for 2024 were lower than 2023 values, showing a difference of -1.18MJ/kg. This year also shows that the results are the lowest over a 5-year period. Given the average moisture levels of barley were close to the corrected value of 13.50%, little differences were seen when comparing as received energy levels of barley to corrected energy levels. By region, The West/Northwest showed the lowest AMEn of 9.91MJ/kg whereas the North/Northeast showed the highest at 12.46MJ/kg, roughly 2.5MJ/kg difference.
Table 3. AMEn values for barley between 2019 and 2023 calculated using the WPSA energy equation (excluding Scotland)

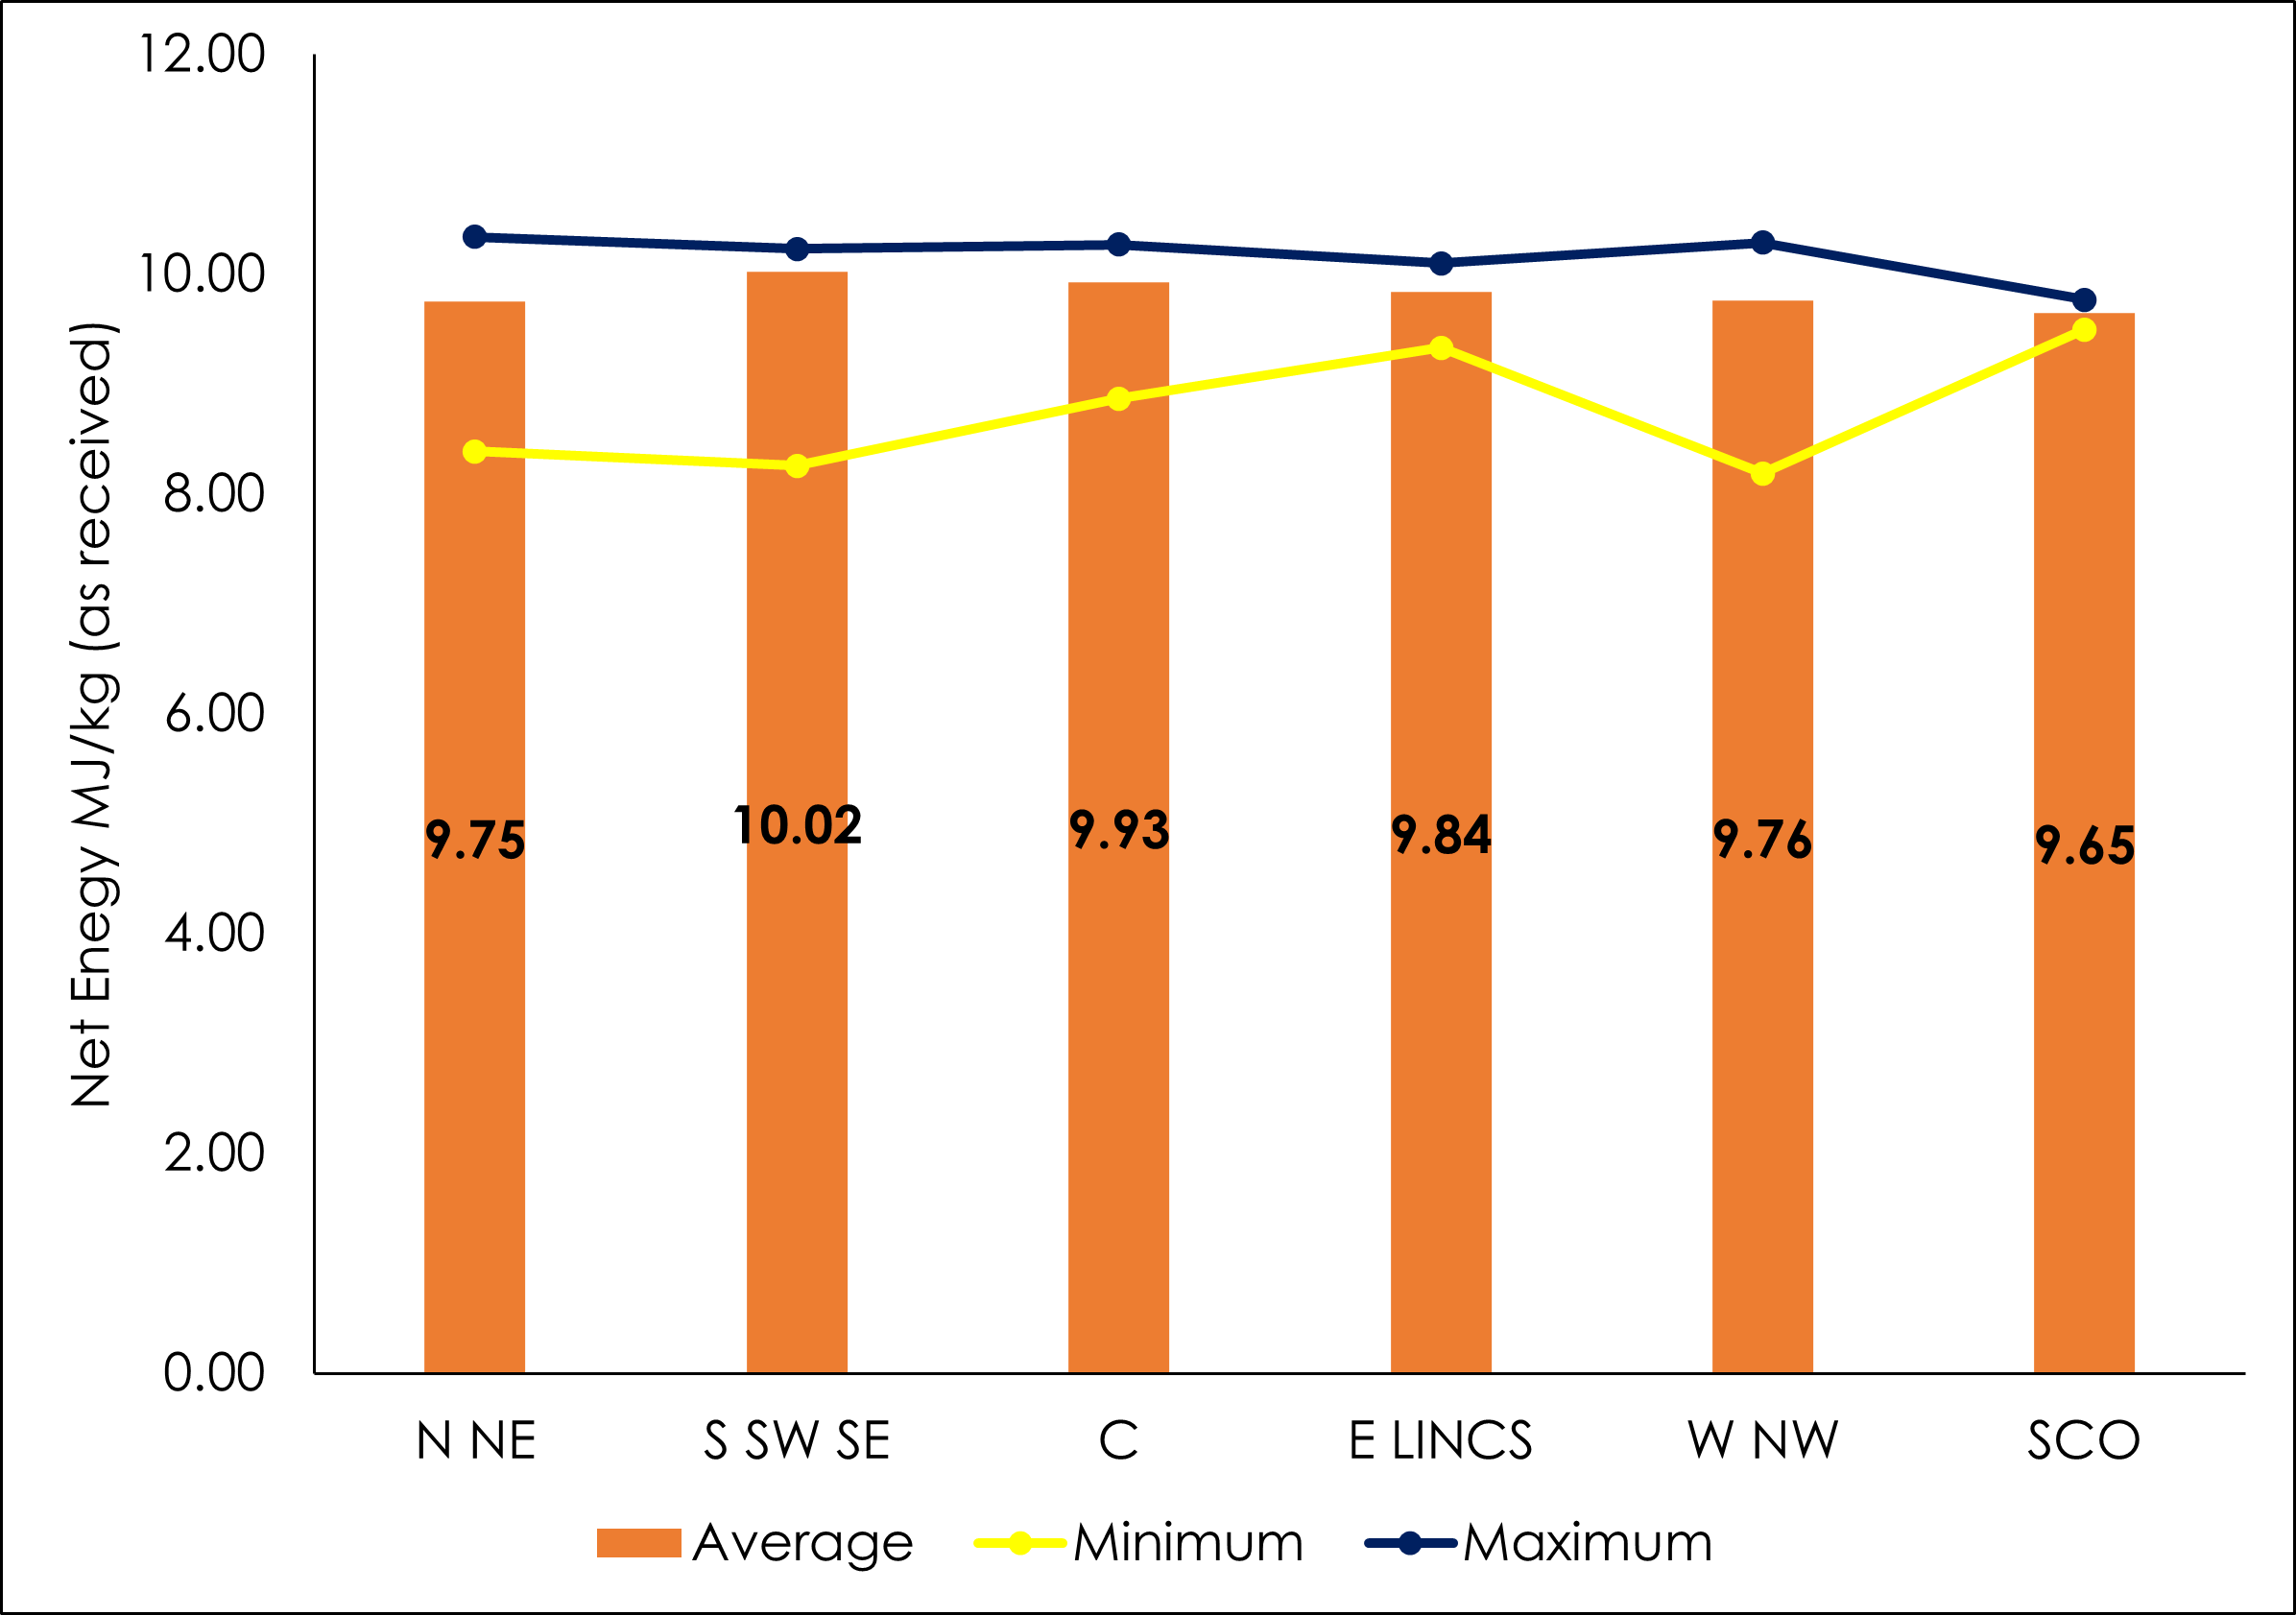
Pig Net Energy (NEp), calculated by the Sauvant et al., 2002 equation, is calculated to be 9.9 MJ/kg excluding Scotland. As with wheat our previous surveys haven’t analysed all the nutrients required to calculate NEp, so we cannot compare with previous survey values. Unlike NEp for wheat, the 2024 NEp value for barley compares closely with the ‘average’ which is expected to be around 9.75 MJ/kg (Premier Atlas, 2019). The variation in energy between regions is shown in Figure 6. To note, energy values may be slightly different between each animal for wheat and barley as the equations used in the calculations differ per pig and poultry.
Figure 6. Regional overview of net energy (Pig) for barley in 2024 (as received basis)
With regard to mycotoxins, risk is relatively low despite the variable weather conditions. However, localised regions may carry higher risks than others for specific mycotoxins, depending on weather in that region along with other environmental factors. Anecdotal reports suggest that ergot is more prevalent this year than 2023. The increased reporting of ergot should prompt more visual checking of raw materials upon delivery in order to help manage risk.
Results observed within our sample set and similar data from across the industry highlights the need for on-going local analysis to ensure that the most reliable information is used when updating matrix values as variation is seen within our sample set as well as other industry data.
Summary tables of proximate analysis and expected amino acid profiles of wheat and barley split by geographical region can be requested by emailing poultry@premiernutrition.co.uk or pig@premiernutrition.co.uk. Furthermore, if you have any questions, or queries about strategies to deal with the effects of mycotoxins or ergot, please contact a member of the pig or poultry team using the emails above.
Finally, we would like to acknowledge the support of our customers for providing the samples that form the basis of this harvest survey and for whom we hope this data is of value.